process visualization
The online visualization runs as a background service on a server and enables access to the AIRLEADER MASTER II and CN from any PC in the network via Internet Explorer and the IP address. It does not matter how many participants access the AIRLEADER at the same time - the visualization does not slow down as a result.
The (sensitive) data is stored in a customers server directory and is then safe by internal data backup. A defect on the memory card of the control unit does not result in irretrievable data loss. On the other hand, missing data, caused by connection interruptions, e.g. are additional stored on the internal controller memory and will be synchronised after re-connection.
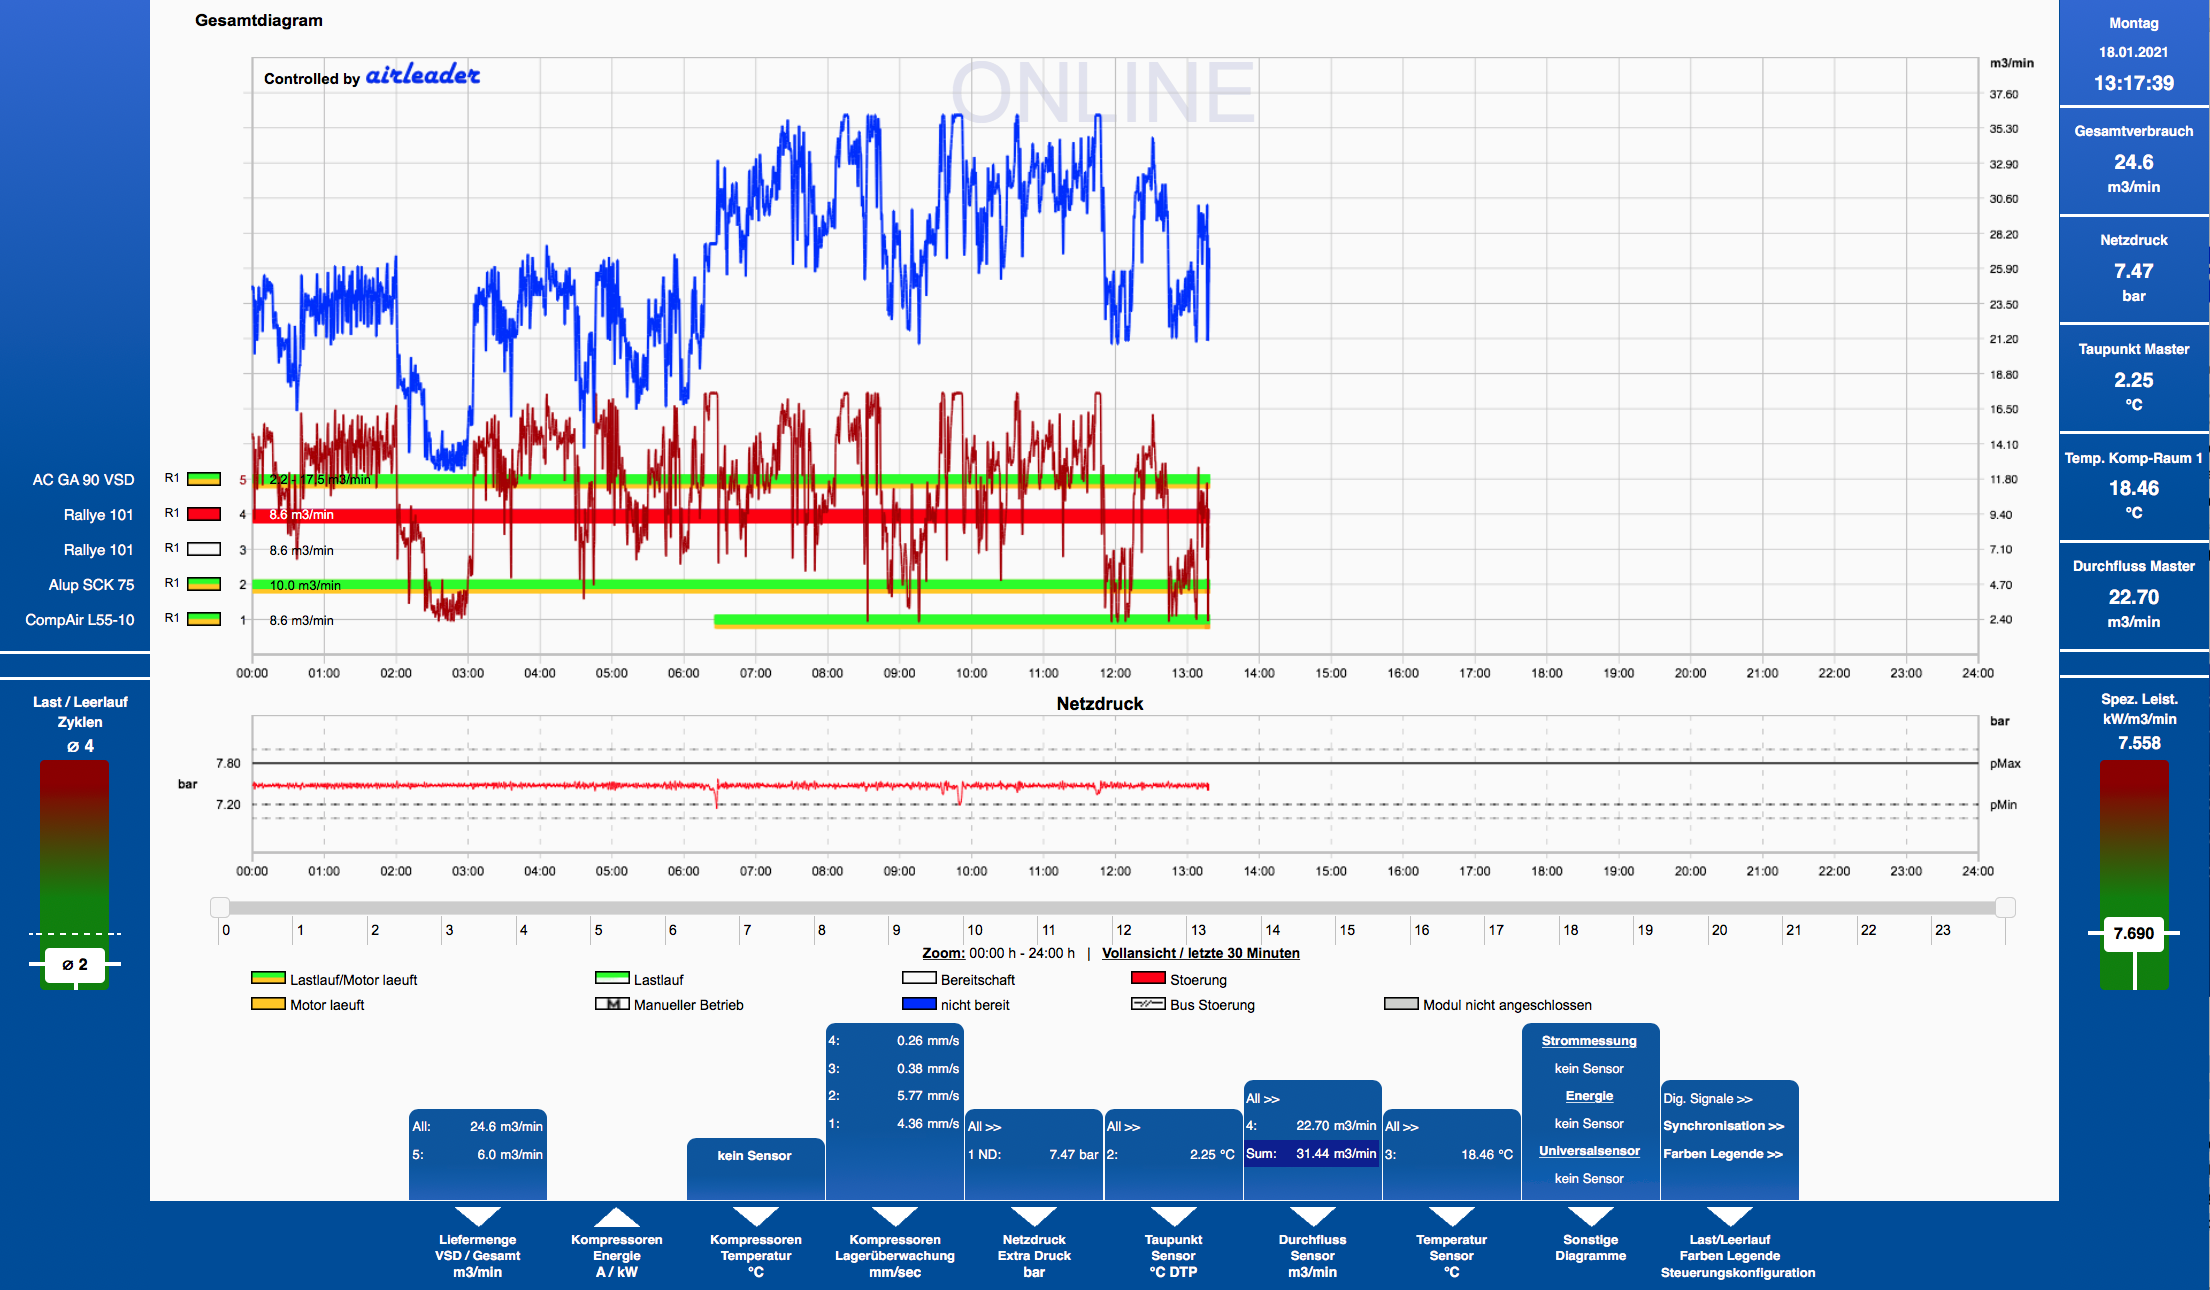
The online overall diagram
provides the perfect overview of the current time with the past 30 minutes or the beginning of the day: all compressor states, the current consumption, the current pressure and the 3 most important ones connected sensors. Furthermore, the current compressed air index and the number of load changes.

Online efficiency bar graph in the lower right corner
Quick access to all connected sensors at the bottom of the screen
With a zoom function, the data can be broken down every hour so that every recorded data point (10 second mean value grid) is visible.
Historical offline total diagram
The overall diagram can be called up for any day in the past - since the control system was commissioned.
This allows analyzing irregularities or special events e. g. leak search, unusual consumption behavior, etc. very precisely.
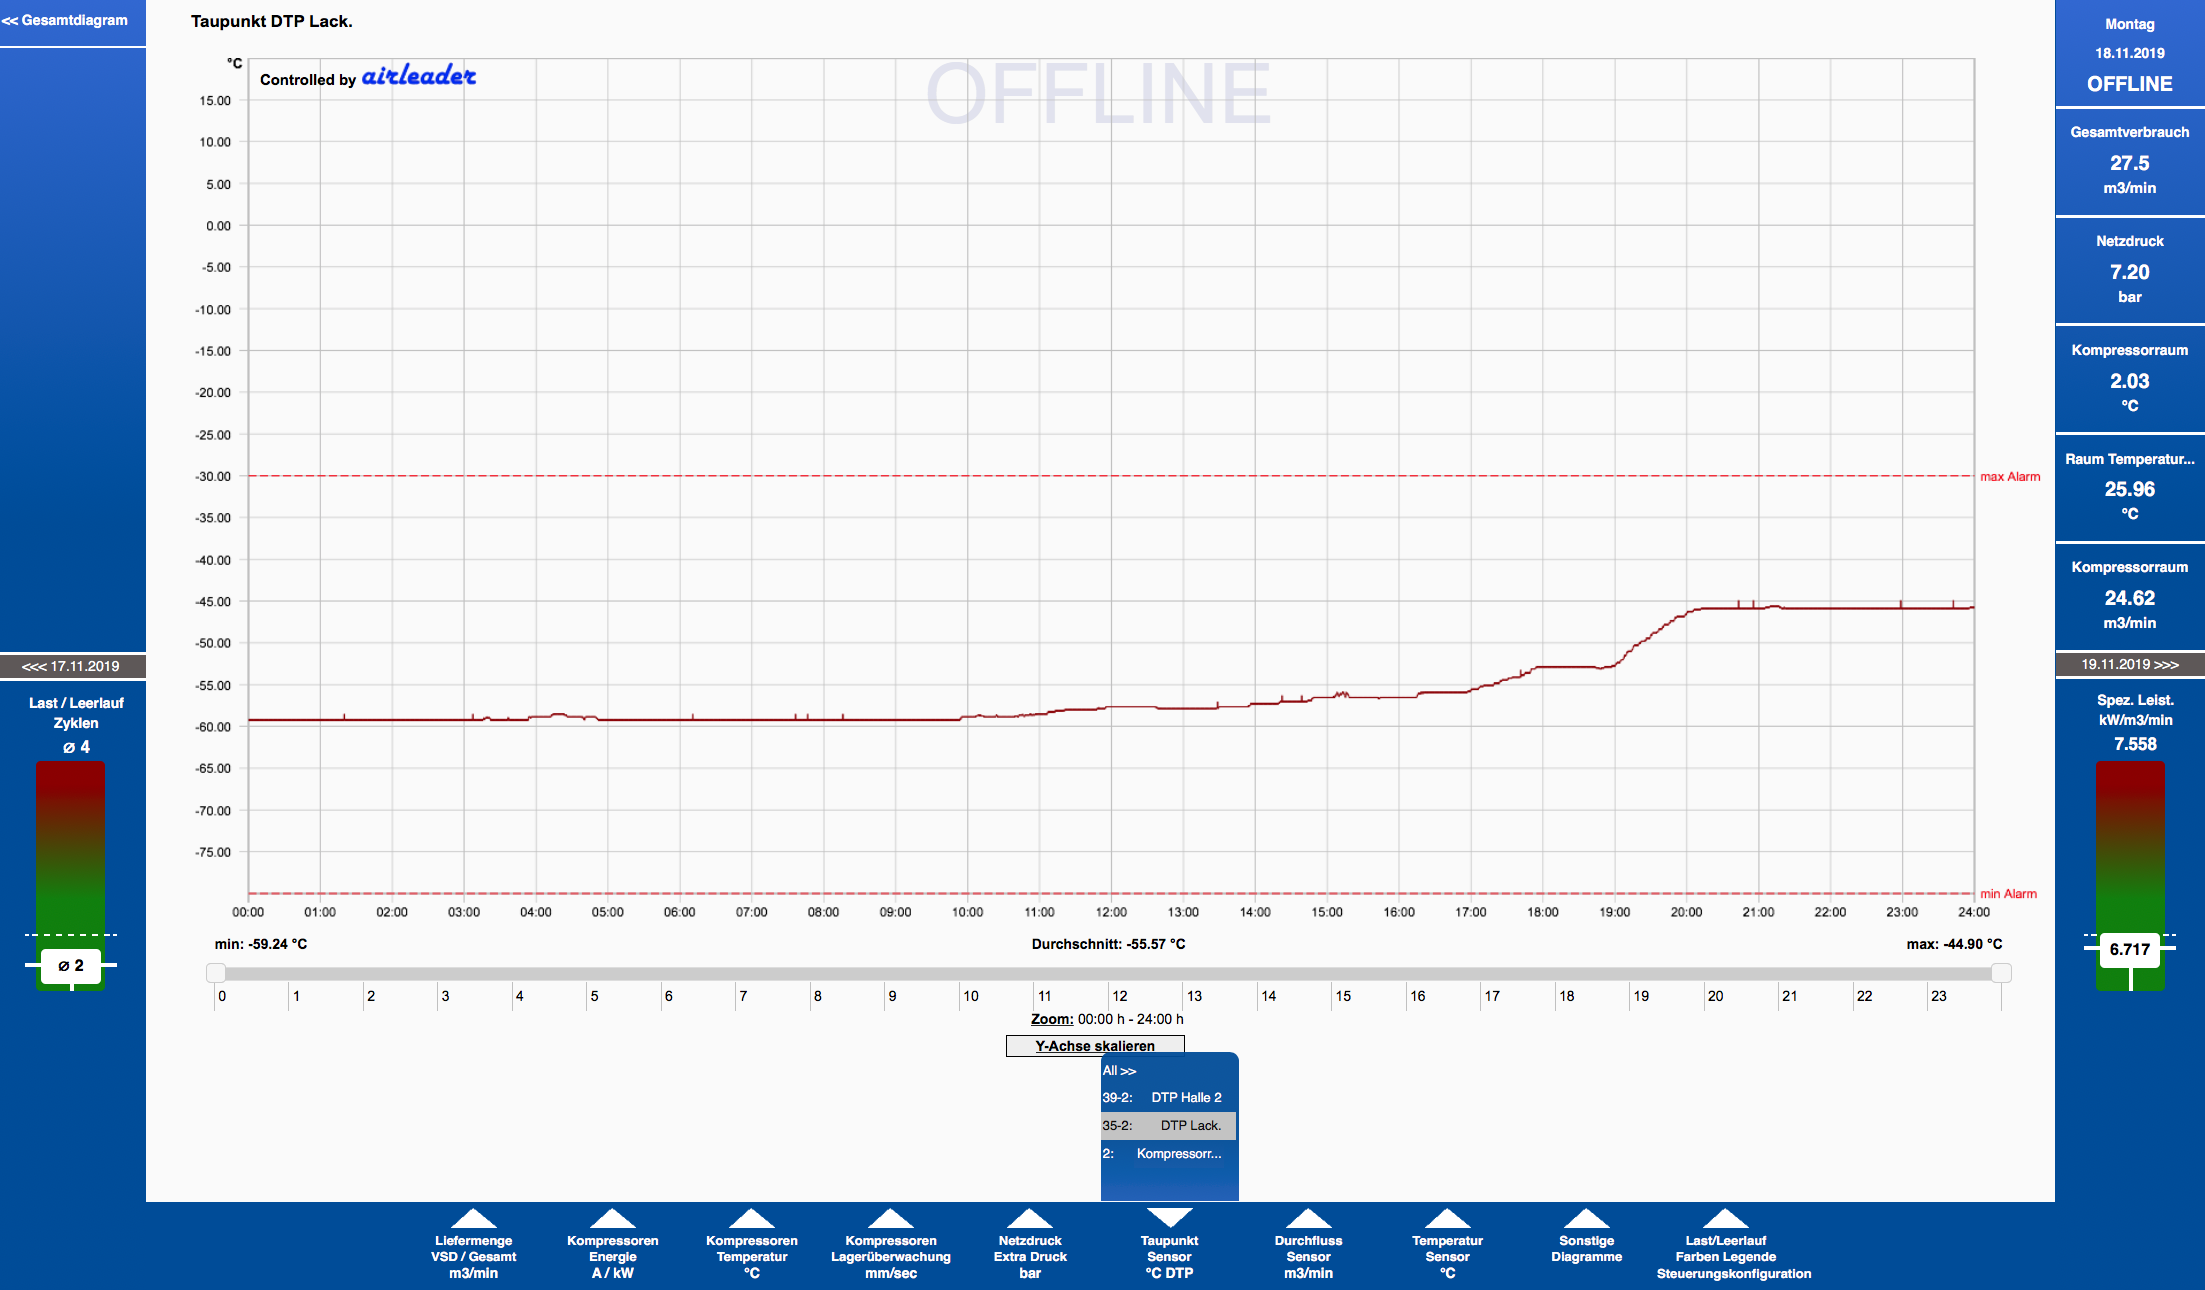
All sensors at a glance
The drop-down menus at the bottom of the screen provide quick access to the connected sensors, e. g. the pressure dew point sensor:

The set alarm limits are also visible in the sensor diagram. Here, too, you can zoom in to the hourly level.
Here you will find 2 stations with real customer data, where you can navigate through the complete visualization:
Demo: Plant with VSD compressor Plant without VSD compressor