compressor data & energy reporting
Automatic energy and compressed air balancing
A report generation periodically and automatically creates a
- daily balance
- weekly balance
- monthly balance
with all energetically relevant compressed air parameters. Clearly compiled for each compressor and added up for the entire station.
User-defined periods of time can be generated by means of a centralised report for any period of time.
The balances can be selected via the archive at any time.
In addition to the energy and runtime data, the number of engine starts and the number of load-idling cycles are recorded, which are usually only a small fraction with the AIRLEADER MASTER module compared to before. This also saves service and spare parts costs.
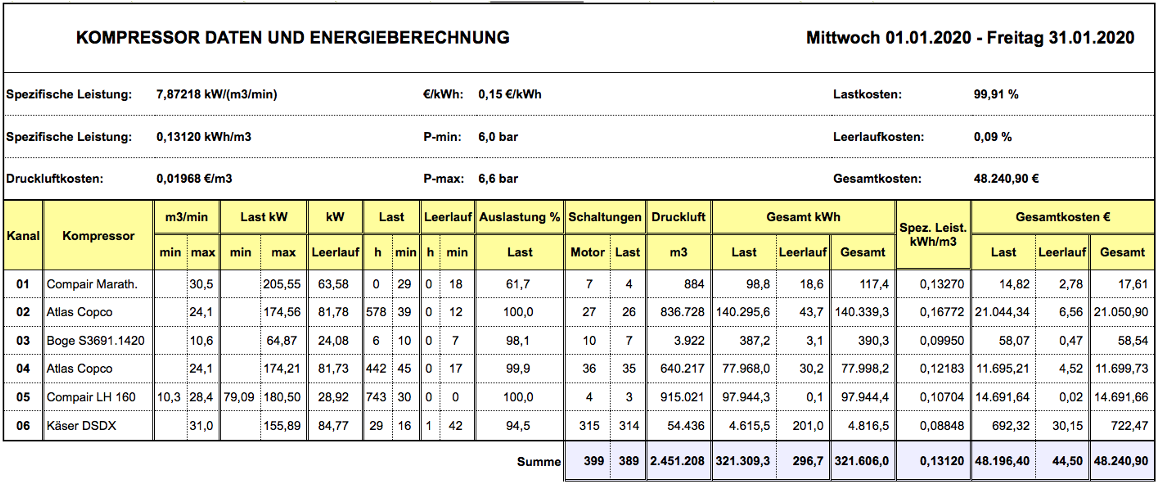
monthly balance
Airleader records real measured energy values, either ex works (see accessories kW / A measurement) or via MODBUS if measuring devices are already installed. This is the only way to ensure that the data conforms to ISO 50.001.
Energy manager compliant
Everything that (not only) the energy manager needs is clearly summarized for the selected time period:
- compressed air index (= specific output) in kWh / m³ and kWh / (m³ / min)
- energy costs per m³ in € / m³
- Energy costs over the period in €
- load share in% and €
- idle share in % and €
- total number of engine starts
- Number of load changes total
- Compressed air volume generated in m³
- Total kWh consumed for this
- per compressor
- name
- Nominal delivery quantity
- Load kW & kWh
- Idle kW & kWh
- Load hh: mm
- Idle hh:mm
- motor starts
- load cycles
- generated compressed air in m³
- spec . Power
- Energy costs: load, empty, total
Simple EXCEL and WORD export
With a click of the mouse, your local EXCEL or WORD program opens, in which the above accounting table is already entered. This means that all fields are available in a handy form for in-house processing. Installed consumption sensors (flow meters) are added up for the respective period in addition to the curve display.
Here you will find 2 stations with real customer data, where you can navigate through the complete visualization:
Demo: Plant with VSD compressor Plant without VSD compressor