Online-visualization
... standard online visualization at its best
Demo: Plant with VSD compressor Plant without VSD compressor
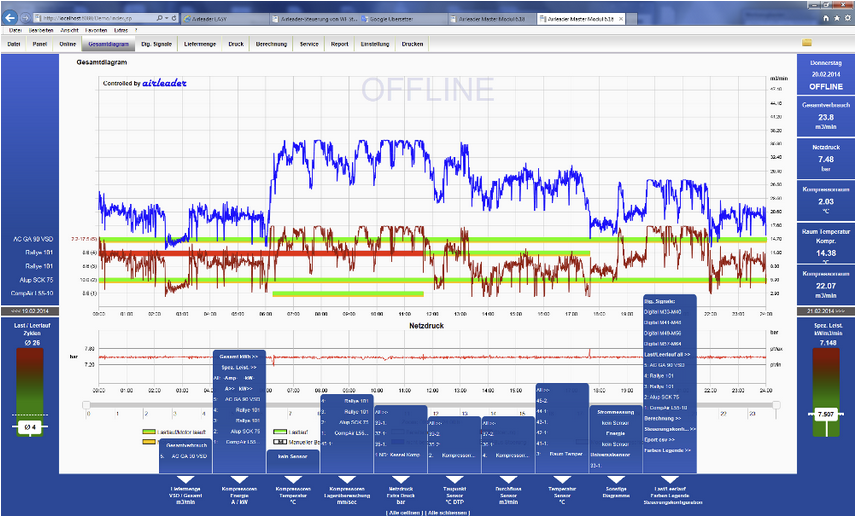
Everything important at a glance
The overall diagram (main image) immediately shows online consumption, pressure and compressor status (load, idle, ready, fault, off, delivery quantity of frequency converter compressors).
Precise curve display
in high resolution - 10x per second - the data is calculated and in diagrams shown. This enables precise assessments.
Extreme zoom function
All curves can be easily zoomed down to 1 hour. Short peaks are recognized and can be traced. Temperature, pressure dew point, flow current consumption, ...? No problem! A large number of sensors can be easily connected (4-20 mA or Modbus) and graphically displayed in high resolution.
Exceeding limits generate messages - on request as e-mail, fax or SMS.
Specific consumption online
With Airleader you can see immediately whether you have Energy costs get out of hand and are automatically notified.
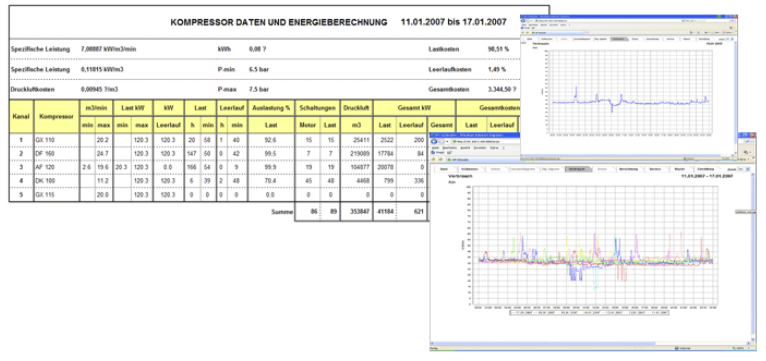
Energy balance for free
The energy and data report provides load and idle times, kWh consumed, m³ generated, spec. Power, energy costs in EUR, engine starts + load changes.
Long-term monitoring is standard The built-in memory has a storage capacity of at least 20 years (with 8 compressors).
Statistics made easy
The load / idle graph clearly shows the savings effect. Simply select the desired period with a click of the mouse.
Predictive maintenance
The service tool with 4 freely definable intervals for each compressor enables precise maintenance planning.
All analog sensors
are clearly arranged
Weeks and monthly diagrams
are automatically summarized and are available
Clear selection of diagrams by selection box
All functions can be used together or each diagram individually
Any number of users
can call up the online visualization via the web server - without any loss of speed.